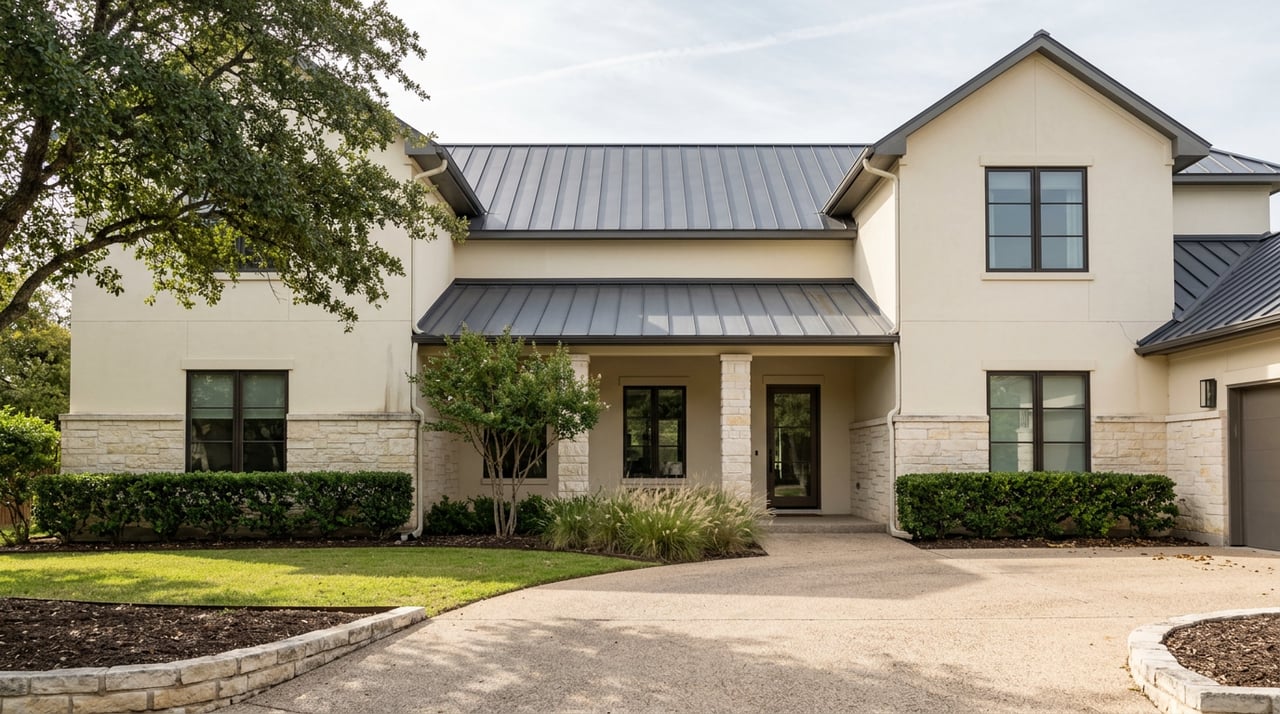
San Antonio's Housing Market Is Cooling. The $1 Million Tier Got a Different Memo.
August 20, 2026
August 20, 2026
"Buyers are benefiting from greater inventory and more negotiating opportunities, while steady price growth continues to support homeowners." That was Ed Zapata, the San Antonio Board of Realtors' 2026 board chair, describing the citywide market after July's numbers came in: more than 3,300 homes sold, sales up 5% year over year, a median price of $315,000, and a six-month supply of inventory that finally puts San Antonio in balanced territory after two years of tilting toward sellers.
It's a fair read of the data. Homes are also sitting longer to get there. The average listing spent 81 days on the market in July, up 11% from a year earlier. If you've been reading San Antonio market coverage while planning a relocation, this is the story you've absorbed: patient market, more room to negotiate, sellers finally meeting buyers partway.
None of it describes what's happening above $1 million.
Kuper Sotheby's International Realty tracks San Antonio's price tiers separately in its monthly market reports, and its own June 2026 numbers tell a story that looks almost inverted from the citywide headline. The $1 million-plus segment posted 181 closed sales against 1,094 active listings that month, a sales-to-list ratio of 95.5%. That's the tightest pricing execution of any price band in the report, luxury or otherwise. Sellers in this tier are getting within a few percentage points of asking price, month after month, while the broader market is absorbing steeper concessions.
The tradeoff is time. Luxury listings averaged 93 days on the market and 138 total days from list to close, both slower than the citywide pace. That's not a coincidence and it's not a soft market wearing a luxury label. It's what happens when the buyer pool is small, deliberate, and rarely in a hurry. A $315,000 starter home draws multiple showings a week. A $1.8 million estate draws the right three or four buyers over three months, and if the seller has priced it correctly, one of them meets the number.
That distinction matters enormously if you're comparing San Antonio to Austin or Dallas and reading citywide days-on-market figures as a signal that sellers here are desperate to deal. In the tier where you're actually shopping, they're not.
The Texas REALTORS® 2025 Sales of Million-Dollar Homes report, covering the twelve months from November 2024 through October 2025, put a number on how differently that money performs locally. The San Antonio-New Braunfels metro logged 736 home sales at $1 million or more during that period, worth a combined $1.05 billion, with the median closing price for that segment landing near $1.3 million. The average $1 million-plus home in the metro spans 4,166 square feet, more than double the 1,930-square-foot median for all residential sales here.
Texas REALTORS® chair Jennifer Wauhob framed the broader trend simply: "High-end homes continue to be a small but mighty segment of the market." San Antonio's slice of that Texas-wide luxury activity is smaller than its Big Four peers by design, not by weakness. Million-dollar transactions in San Antonio-New Braunfels made up about 5% of all Texas luxury home sales in that period, compared with 38% in Dallas-Fort Worth, 27% in Houston, and 19% in Austin. That gap is the value case, not a red flag. It's a smaller, quieter luxury market sitting inside one of the more affordable major Texas metros, which is exactly why buyers priced out of Austin's upper tier keep showing up here with cash and a shorter list of must-haves.
The luxury agent side of the business backs this up. A San Antonio Business Journal ranking of the market's top luxury producers found 31 agents and teams combined for roughly $852 million in sales volume in 2025, with a minimum of $12.5 million in personal production required just to make the list. That's not a market coasting on a handful of trophy closings. It's sustained, professionally managed transaction volume at the top of the price ladder.
Citywide reports tend to average everything into one number, which erases the geography that actually drives this segment. Market analysts tracking San Antonio's prime submarkets describe Alamo Heights and the adjacent Olmos Park enclave as the neighborhoods where price growth has visibly separated from the citywide median, a pattern brokerages covering the prime side describe as a widening price band rather than a uniform market. Stone Oak and the broader north side continue to anchor the upper end from the suburban side, with newer construction expanding faster in the outer corridors while the established gated sections hold their premium.
That's the map most relocating buyers are actually shopping, whether or not the headline they read used those names. The Dominion, Shavano Park, and the hill country submarkets further out each carry their own version of the same story: fewer transactions, more deliberate buyers, and sellers who aren't chasing the citywide discount trend because they don't have to.
If you're relocating from a market where $1 million buys a standard suburban house on a small lot, the San Antonio comparison isn't apples to apples, and it shouldn't be read through citywide statistics either. The number that actually applies to your search is the 95.5% sales-to-list ratio in the segment where you're shopping, not the 81-day average across a market where two-thirds of transactions close under $500,000.
Here's the practical version of the split, based on the figures above:
| Citywide (July 2026) | $1M+ segment (June 2026) | |
|---|---|---|
| Sales-to-list ratio | Not separately reported; concessions increasingly common | 95.5% |
| Days on market | 81 days, up 11% year over year | 93 days average, 138 total days list to close |
| Price direction | Median $315,000, up 2% year over year | Median closing price near $1.3 million (12-month trailing) |
| What's driving it | Higher inventory, buyers gaining leverage | Small, patient buyer pool; sellers holding price |
The takeaway for a relocating executive or a second-home buyer isn't that San Antonio's luxury market is hot in the conventional sense. It's that the negotiating leverage everyone's talking about doesn't extend into this price band the way the headlines imply. Financing needs to be arranged before you're seriously looking, not during a slow-walked option period, because the property that fits will move at close to asking when the right buyer shows up. Presentation matters more here too. In a segment where 181 homes closed against nearly 1,100 active listings in a single month, the properties that command full value are the ones staged and marketed to stand out in a pool that size, not the ones priced to test the market.
Does the citywide "buyer's market" language apply to homes over $1 million in San Antonio? Not based on the pricing data. Buyers in that tier do get more time to decide and more inventory to compare, but sellers in the $1 million-plus segment are still closing near asking price according to Kuper Sotheby's June 2026 figures, which is a different dynamic than the concessions showing up in the broader market.
Why does San Antonio's luxury segment make up a smaller share of Texas million-dollar sales than Dallas or Houston? Partly scale. Those metros are larger and have deeper luxury inventory. It also reflects San Antonio's positioning as the more affordable major Texas metro, which is precisely what continues to draw relocating buyers from higher-cost markets into this price tier.
Is a longer time on market in this segment a sign of overpricing? Usually not on its own. The 93-day average and 138 total days reflect a smaller buyer pool making deliberate decisions, not general softness. Overpricing shows up as extended time on market combined with a falling sales-to-list ratio, which isn't what June's numbers show.
If you're weighing a move into San Antonio's upper price tiers, or trying to figure out what your current home in Alamo Heights, The Dominion, Stone Oak, or the hill country is actually worth against this data, The Ross Group can walk you through the specific comparables behind these numbers. Request your complimentary luxury home valuation and get a read on where your property sits in a market that behaves nothing like the headlines suggest.
Stay up to date on the latest real estate trends.
Etiam non quam lacus suspendisse faucibus interdum. Orci ac auctor augue mauris augue neque. Bibendum at varius vel pharetra. Viverra orci sagittis eu volutpat.